Industrial IoT Edge-to-Cloud Telemetry Lab
A working industrial IoT prototype built around a physical Velocio ACE PLC, Raspberry Pi Zero 2 W edge gateway, secure MQTT transport, Google Cloud infrastructure, a PostgreSQL / TimescaleDB historian, a FastAPI history service, and a live browser dashboard. The system acquires real PLC inputs, publishes structured telemetry over TLS, survives network outages, replays missed events from a durable SQLite store-and-forward queue, and preserves cloud-side event history across browser sessions and infrastructure reboots.
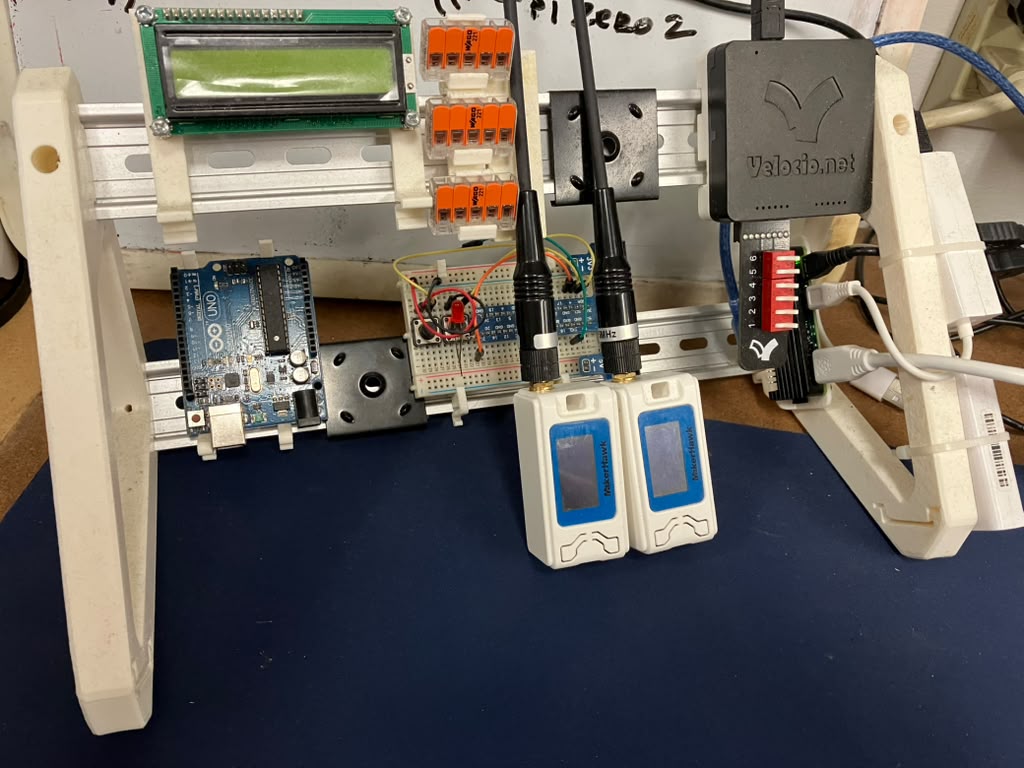
Real controller. Real edge gateway. Real cloud path.
The lab uses the same separation of responsibilities found in larger industrial telemetry systems: the controller owns machine I/O, the edge gateway handles acquisition and transport, the broker handles messaging, the historian persists operational history, and the browser combines durable history with the live stream.
The PLC remains the authoritative controller. The Pi edge gateway performs protocol translation, state normalization, buffering, secure transport, event identity, and recovery behavior. Cloud services persist and present telemetry rather than replacing local control logic.
From switch contact to live telemetry and durable history.
Every layer in the current build is active and independently testable.
Hardware + edge
Cloud + application
The actual path to the cloud.
The edge gateway traverses a real Wi-Fi / switched / cellular uplink rather than sharing the browser's connection path. This makes it possible to test true edge network failures while the dashboard remains online.
Why the separate viewer path matters
The Pi can lose Wi-Fi while the browser remains connected to Google Cloud. This lets the dashboard visibly observe Last Will status transitions, stale telemetry age, recovery, and buffered-event replay.
Public exposure
Plain MQTT on port 1883 is restricted to localhost on the VM. External edge traffic uses TLS on 8883. Browser MQTT is proxied through nginx as secure WebSockets. PostgreSQL and FastAPI also remain local-only and are reached externally only through the intended HTTPS history endpoint.
Designed to survive a broken network path.
Connectivity loss is treated as a normal operating condition rather than a fatal application error. Local PLC polling is separated from disk and cloud delivery so the controller acquisition loop remains responsive during outages.
The polling thread reads C1–C6 from the ACE PLC. A transient Modbus read failure gets one short retry before the read is reported as failed.
State-change events are handed to a background persistence worker and committed to SQLite before cloud delivery is considered complete.
One SQLite row is published at a time with MQTT QoS 1. The row is deleted only after Paho receives the broker acknowledgement.
Network recovery
Paho retries automatically after Wi-Fi or WAN loss. On reconnect the gateway republishes current retained state and resumes pending delivery.
Store-and-forward
Events remain on local storage while the cloud path is unavailable. Buffered events are replayed oldest-first after reconnection.
Offline detection
Mosquitto publishes the retained offline status when the edge connection expires, allowing the live dashboard to distinguish broker connectivity from device state.
End-to-end event IDs
Every physical transition receives a persistent edge-generated event ID and sequence. That identity survives SQLite buffering, MQTT replay, ingestion, TimescaleDB storage, API retrieval, and browser display so duplicate deliveries can be safely suppressed.
Automatic service restart
The Pi edge agent, Mosquitto broker, PostgreSQL / TimescaleDB, MQTT ingestor, and FastAPI service are managed for automatic startup. Full VM and edge-side restart paths were tested with telemetry resuming after boot.
The Pi Wi-Fi path was intentionally disconnected while the ACE PLC remained active. Switch transitions were generated both before and after MQTT detected the outage. After Wi-Fi restoration the edge agent reconnected automatically, restored current state, and replayed the six missing events from SQLite as BUFFERED history. Replayed events preserve their original timestamps and event IDs before being written to the cloud historian.
Current state and historical events are separate concepts.
Retained state provides the latest machine snapshot. Events preserve individual transitions. Status tracks edge availability. Every event also carries a persistent edge-generated event ID so the historian and browser can distinguish event identity from transport delivery attempts.
| Topic | Purpose | QoS / retain |
|---|---|---|
| fortressflash/lab/ace11-plc/state | Current C1–C6 input snapshot and sequence metadata. | QoS 1 / retained |
| fortressflash/lab/ace11-plc/events | Individual input transitions. Replayed rows include BUFFERED and replay timestamps. | QoS 1 / not retained |
| fortressflash/lab/ace11-plc/status | Online/offline state used by the dashboard and MQTT Last Will. | QoS 1 / retained |
Live event payload
Replayed buffered payload
Live transport and durable history are separate layers.
MQTT remains the real-time transport. PostgreSQL / TimescaleDB is the durable cloud-side system of record for individual PLC events. A local Python ingestion service subscribes to the event topic, normalizes typed values, and writes each event to the historian using the edge-generated event ID.
Historian write path
Browser read path
Encrypted transport with constrained broker access.
The public-facing MQTT path is encrypted and authenticated. Browser access is intentionally separated from edge publishing permissions.
A live view of the physical controller.
The browser UI combines two independent data paths: MQTT over WSS/TLS for immediate live state and event updates, plus an HTTPS historian API for durable history. Replayed store-and-forward events remain visibly tagged BUFFERED after refresh because that provenance is stored in TimescaleDB.
What the operator sees
Current behavior
A physical switch change is detected by the Pi, assigned a persistent event ID, persisted locally, delivered with MQTT QoS 1, acknowledged by the broker, written into TimescaleDB, and reflected in the browser. If the edge link fails, acquisition continues locally and pending events drain after recovery into both the live stream and the historian.
What comes after the reliable telemetry path.
The controller-to-cloud path, durable historian, HTTPS history API, and hybrid live/history dashboard are operational. Future work focuses on packaging, infrastructure automation, reconciliation, bidirectional HMI control, and additional industrial interfaces.
Dockerize server-side services. Package broker, ingestion, and later data services for repeatable deployment.
Terraform / IaC. Capture the Google Cloud VM, firewall policy, networking, and supporting resources as version-controlled infrastructure.
Edge-to-cloud continuity checks. Use persistent event IDs / sequences to compare edge progress against historian state and explicitly repair missing ranges when needed.
Bidirectional commands. Map ACE outputs and send authenticated supervisory commands from the browser while retaining PLC-side control and interlocks.
Additional protocols and links. Candidate additions include OpenPLC, OPC-UA, CAN/BMS telemetry, LoRa-constrained links, and simulated industrial processes.
This lab now demonstrates a complete physical edge-to-cloud telemetry path: industrial controller acquisition, Linux edge processing, durable store-and-forward, persistent event identity, automatic network recovery, MQTT QoS 1 delivery, TLS, authentication and ACLs, cloud-hosted messaging, PostgreSQL / TimescaleDB history, a FastAPI HTTPS history service, systemd-managed service recovery, secure browser WebSockets, event deduplication, and combined live + historian visualization.